A work graph is a connected sequence of steps that teams execute to get work done. It is, in essence, a map of how teams execute digital work, and it lies at the intersection of people, work, and technology. Once discovered, the work graph enables teams to collaborate and work more effectively.
What is a work graph?
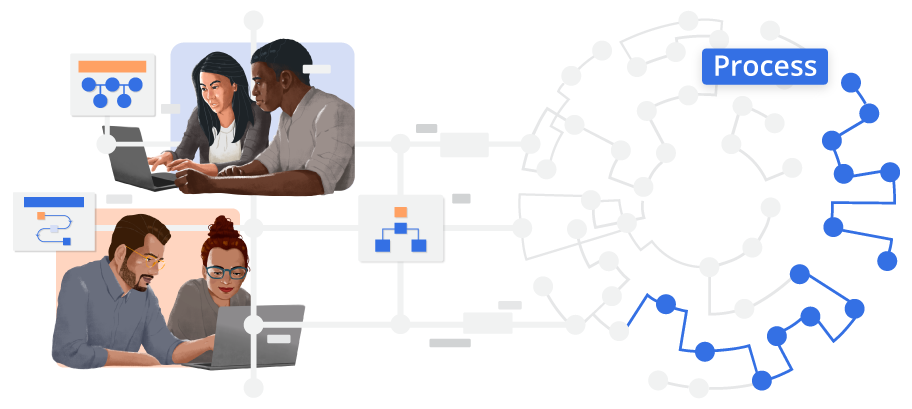
Work graph: The DNA of Digital Work
For far too long the human experience at work has been broken. Work is a product of three entities: (1) people using (2) technology to execute (3) tasks, processes, and activities. The least understood part of how work happens lies in the last mile of how teams interact with technology. However, existing digital transformation initiatives do not place value on the human experience. The work graph places the human (and by extension the team) at the center of how work happens. It is excavated by learning patterns of work from interactions between people and machines. In effect, it represents how teams experience work and forms the basis for any improvements to work.
See examples of how the work graph benefits users, teams, managers, CXOs, and customers

Eliminate friction in a team’s daily work
Teams at a Fortune 500 FMCG company complained of the tediousness and boredom of having to pull data from multiple systems. The work graph highlighted, an average of over 150 context switches for each completed transaction leading to an increase in drag to the team. Using data from the work graph, the company restructured the process, aggregated data, and cut the drag by 25% from daily lives of users.

Find learning opportunities
A leading tax and audit consulting firm leveraged the work graph to detect the several different ways similar transactions were processed by the same team. The data highlighted a key lacuna - the team was often unsure of which steps to take and when. The work graph was able to identify the variations and enabled the team to generate a standardized document. This enabled learning opportunities, thus improving throughput by 20%.

Catalogue how work happens
A Fortune 500 pharmaceutical company analyzed work graphs across supply chain, customer service, and enabling functions in 15+ countries spanning 1000s of users. Using this data, they generated a baseline that cataloged 35,000 tasks, 900 processes, and 42,000 variants that accounted for how teams were getting work done.

Manage teams more effectively
During the pandemic, a Fortune 500 insurance company, gave managers data from the work graph to highlight the overlap in their teams’ daily work. By making minor adjustments to team overlap and quorum sizes, managers achieved a 15% increase in team throughput. Further results are highlighted here in this Harvard Business Review article.

Reduce turnaround times
A COO at a F500 insurance company used the work graph of the entire sales organization to identify and narrow down a 5% drag on quarterly sales numbers. The drag emanated from key technology features missing in the tech stack causing significant slowdown in contract closures. Based on this discovery, the COO was able to make appropriate tech investments to secure the 5% drag.

Create a culture of data
A F500 financial services company gained significant advantages by leveraging the work graph for the past two years. Now it is elevating the work graph as a new data plane at the heart of all its work transformation initiatives including decisions on automation, training, learning and development, IT investments, among others.
Reduce turnaround times
Business leaders trying to identify how to improve CX used the work graph to map the customer journey. By identifying back-office processes that had the greatest impact on customer wait times, they were able to focus optimization efforts and reduce average handling times by 30% and improve first-call resolution.

Deliver smoother experiences
Customers of a leading insurance company were able to get claims settled faster through improvements made by the policy administration team to their processes. By leveraging the work graph, the team was able to identify how to minimize errors during processing, thereby improving the downstream experience.

Work graph lovers
Organizations leverage multiple levers for their transformation goals from information that is derived from their work graph.
Learning opportunities
Standardization
IT Enhancement

Templatization
Automation
Work graphs are powering


Work graph privacy: Focus on a team, not the individual
Soroco sets the gold standards for work graph privacy

Always Opt-In
Programs that collect work graph data must not collect any information by default. Applications and URLs must be explicitly approved by a user to have information gathered

User Anonymized
Work graphs are meant to identify and represent a team’s work patterns and not any individual’s. No specific user should be identifiable within a work graph

Privacy Aware
Work graphs must not collect any PII before ingestion and users must be provided the option for setting PIIs granularly

GDPR Compliant
Work graph data must be stored on-premise or in a legal jurisdiction of the client’s choosing. Users must have the control over their data and the right to be forgotten
Frequently Asked Questions
Work graph can be derived from a team as small as five people and as big as the entire enterprise. Larger the team, sharper the insights and benefits it delivers. The work graph helps figure out common patterns, where teams can optimize their work, which activities to spend time on or how teams can work differently and better.
For digital transformation initiatives, a work graph platform like Scout can help identify initial insights within 48 hours. A good work graph data set could be achieved with a team of 5 – 10 users in 4 weeks of discovery. However, we do recommend that larger data sets could provide all variations for analysis to achieve most optimal results.
Work graph reveals complex datasets which require a tool for interpretation, Soroco’s Work Insights is one such visualization product. These visualization tools help identify challenges or opportunities within the discovered work. Users and teams can then collaborate and drive improvements on various KPIs through multiple change levers
Work graph: The latest addition to the graph family
Graphs are all around us every day, from metro maps to social networks, helping us understand large and complex data easily. They help us identify relationships between entities, interpret information, and draw conclusions. The work graph helps us do the same for work.